Quick Links
Introduction
In the past 40 years air transportation has undergone rapid development and come to be a major means of long-distance travel in many countries for both freight and passengers. Different agencies have accumulated huge amount of aviation data which are extremely valuable for research and market investigation. However, such data are usually difficult to find and hard to use.
Sky Explorer is a WebGIS that maps aviation data from multiple data sources in a vivid way and present the statistics in user-friendly format. Taking advantage of GIS and cartography technology, the texts and numbers in aviation database are interpreted vividly. User can interact with the geographic data and get the fact more quickly. These maps and charts provides a good illustration of development and current landscape of the aviation industry. We believe that this system can benefit multiple actors involved in the air transportation process: travelers, airport planners, regional planners, policy makers, business decision makers, graduate students and researchers in transport geography.
Data Sources
The original version of Sky Explorer focuses on T100 Air Carrier Statistics, provided by Bureau of Transportation Statistics(BTS) in United States. In this new version, several new data from aviation authorities have been integrated. Here is a list of data providers for this system.
- US BTS (airport and route data)
- United Kingdom Civil Aviation Authority (airport and route data)
- Taiwan Civil Aeronautics Administration (airport and route data)
- Korea Airports Corporation (airport and route data)
- Civil Aviation Administration of China (airport data)
- Swiss Federal Statistical (Airport data)
- Japan Ministry of Land, Infrastructure, Transport and Tourism (airport and route data)
- Mexico Secretariat of Communications and Transportation (airport data)
- Australian Bureau of Infrastructure, Transport and Regional Economics (airport data)
- Macau International Airport (airport data)
- Airports of Thailand Public Company Limited (airport data)
- Wikipedia (route connection)
Data Properties
Sky Explorer’s first version visualizes T100 Air Carrier Statistics, provided by Bureau of Transportation Statistics(BTS). As the system becomes more and more powerful, several data sources provided by agencies all over the world are integrated.
Here are some notes for the data input process:
- Some routes with small flows would be filtered according to certain criteria. Generally speaking, we defined a standard for qualified routes. The monthly number of passengers and freight in these routes should exceed a minimum threshold for at least two months in one year. Only these routes are in the database.
- For the routes statistics, this system only present the data for schedule flights (including seasonal flights). Airport flow statistics include all commercial activity.
- Different data providers apply different standard for data collection, processing and output. Therefore inconsistency may exist between two data sources for the same route. It’s not recommended to compare data from multiple data sources.
- Some data sources provider detailed information. For example, US T100 provide the operating airline, operating aircraft, passenger, seat freight and movement for each route. However some providers only give the monthly statistics for each route.
- Sources data are not 100% correct. I have tried my best to fix them when integrating the data to the system.
- Although great effort has been taken to make sure all statistics in the system is correct, it might still contain errors. We take no responsibility for any damage or loss suffered by any party as a result of the use of, or reliance upon the statistics or information published on this website.e of, or reliance upon the statistics or information published on this website.
Features
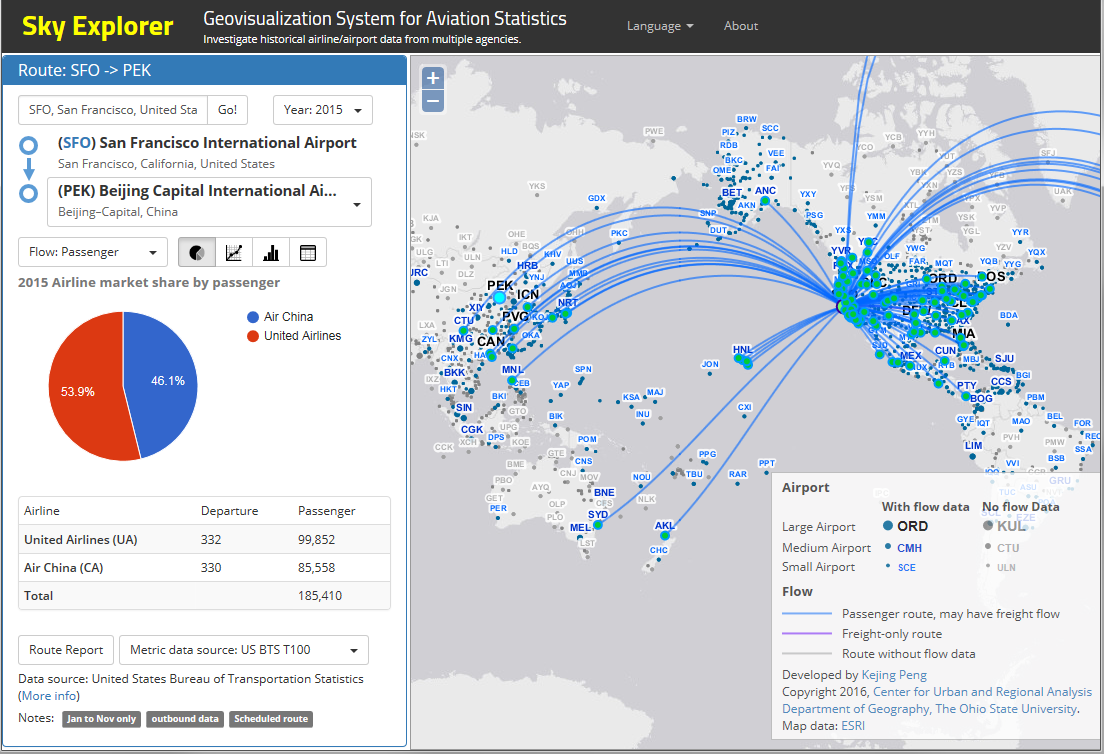
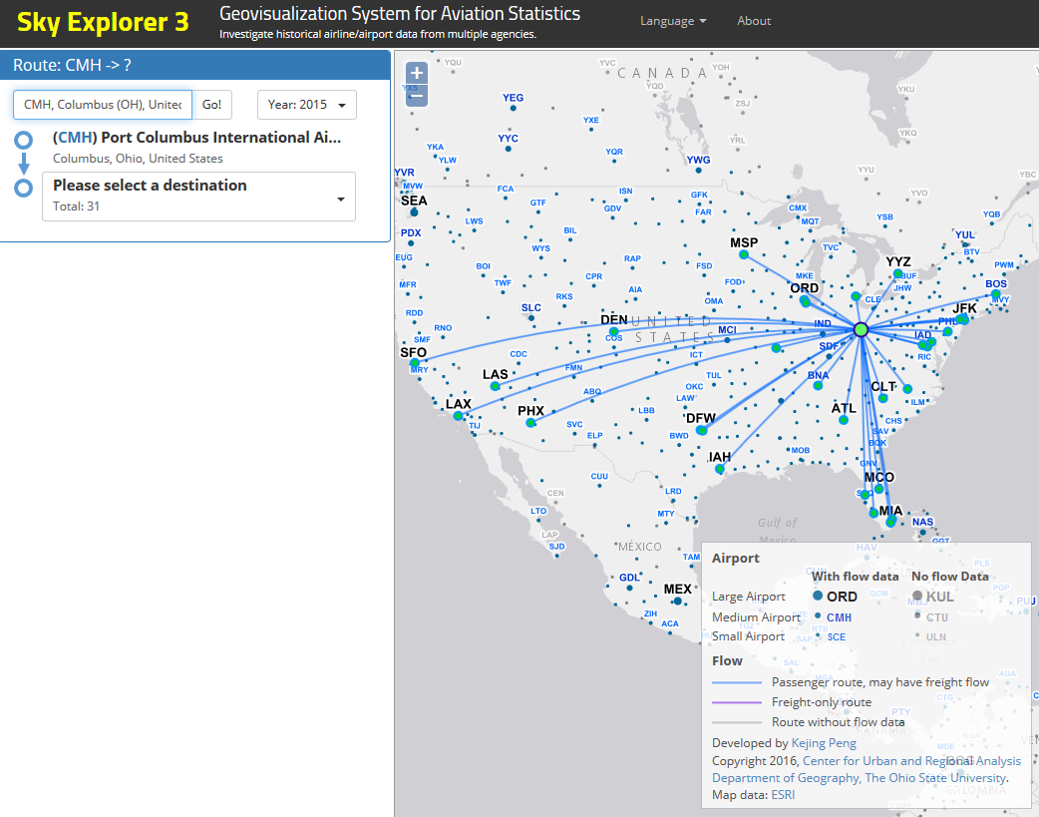
Show the connection
Show the routes from a selected airport. You can specify an airport by searching its code/name or clicking a location in the map.
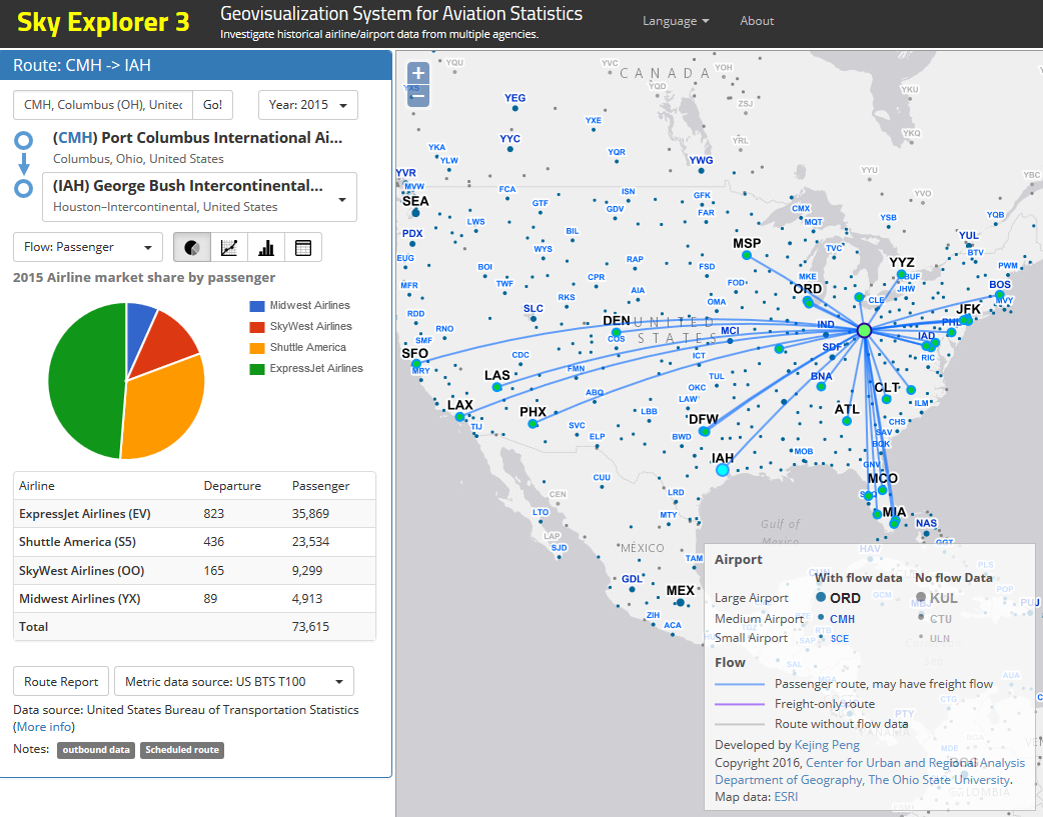
View Route Data
After selecting an original airport, you could click a destination in the map, or select one from the dropdown control in the left pane.
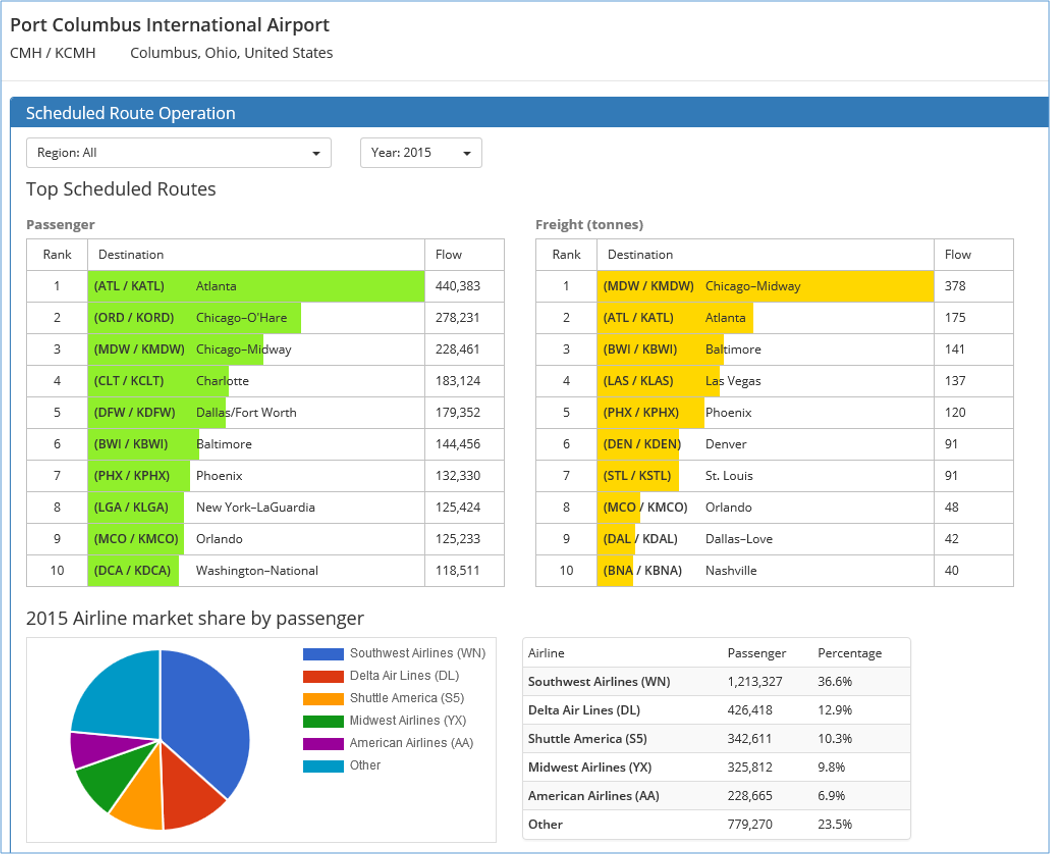
Show Airport Report
An airport report page will show if you click the code of the original airport (i.e. CMH in the preview screenshot). The report shows the annual/monthly flow (all commercial activities), and popular destination of scheduled flights(if available from the data sources)
Show Route Report
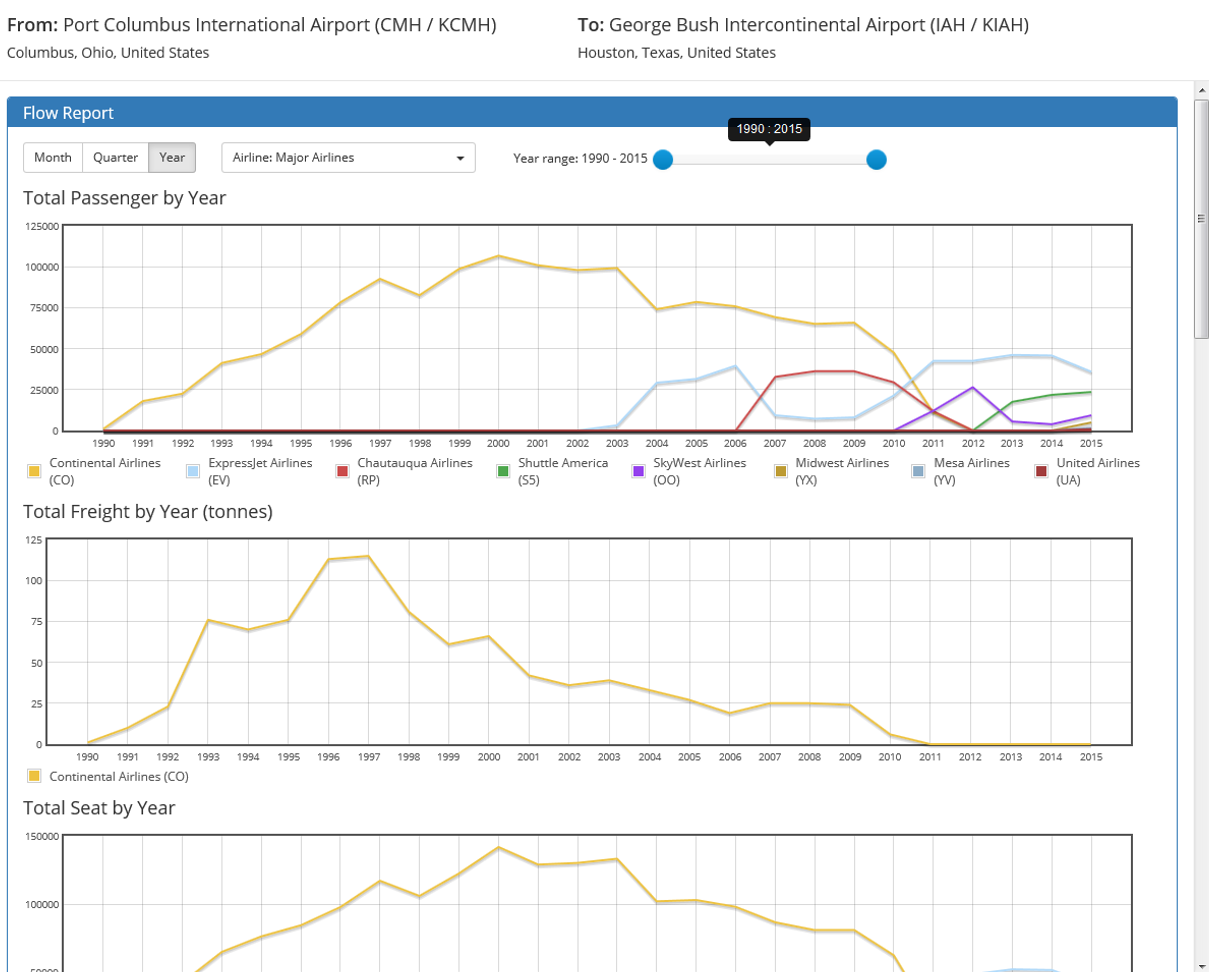
A route report page will show if you click the “Route Report” button at the bottom of left panel. The report shows the annual/month flow for this route, operation history and aircraft usage (only for US routes). We only show the data of scheduled activities.
Technology
This application takes advantage of open source technology. The geovisulization of aviation data is powered by several famous open source GIS software: PostGIS, GeoServer and OpenLayers 2. The 3.0 version tries to use OpenLayers 3. However the vector render performance is not great so I have to continue using OpenLayers 2. Python is utilized to process the source data. Besides, ESRI Basemap is used as the basemap for this WebGIS. Data service is implemented with Microsoft AST.NET. Another hightlight is that JavaScript programming is implemented with TypeScript, a free and open source programming language developed by Microsoft. The website also uses Angular and Bootstrap.
This WebGIS is tested under following browsers: Internet Explorer 11, Edge, Firefox and Chrome.
About
This WebGIS is developed by Kejing Peng under the supervision by Professor Morton O’Kelly. Kejing was a graduate student in Department of Geography and now is a software engineer in Microsoft.
I try my best to keep all the records in the database accurate. However, we take no responsibility for the data within this website, nor any responsibility for the consequences of using the data within this website. If you have any suggestion, or discover bugs/data errors, feel free to send me email (gz.pkkj@gmail.com) with detail information.
Old Versions
The first version is called “T100 Geovisualization” because its primary objective is to show the US T100 data in the map. It’s implemented in Silverlight. (Launch)
The second version is rewritten in JavaScript and provider data from multiple sources. (Launch)
Acknowledgement
Thanks to the Department of Geography in Ohio State University and the Center for Urban and Regional Analysis.